Precip for professionals
Every site you run.
Measured, not guessed.
Know exactly what fell at each field, job site, and property. Get alerted the moment conditions cross the line that changes your day, and pull the whole record into your own systems.
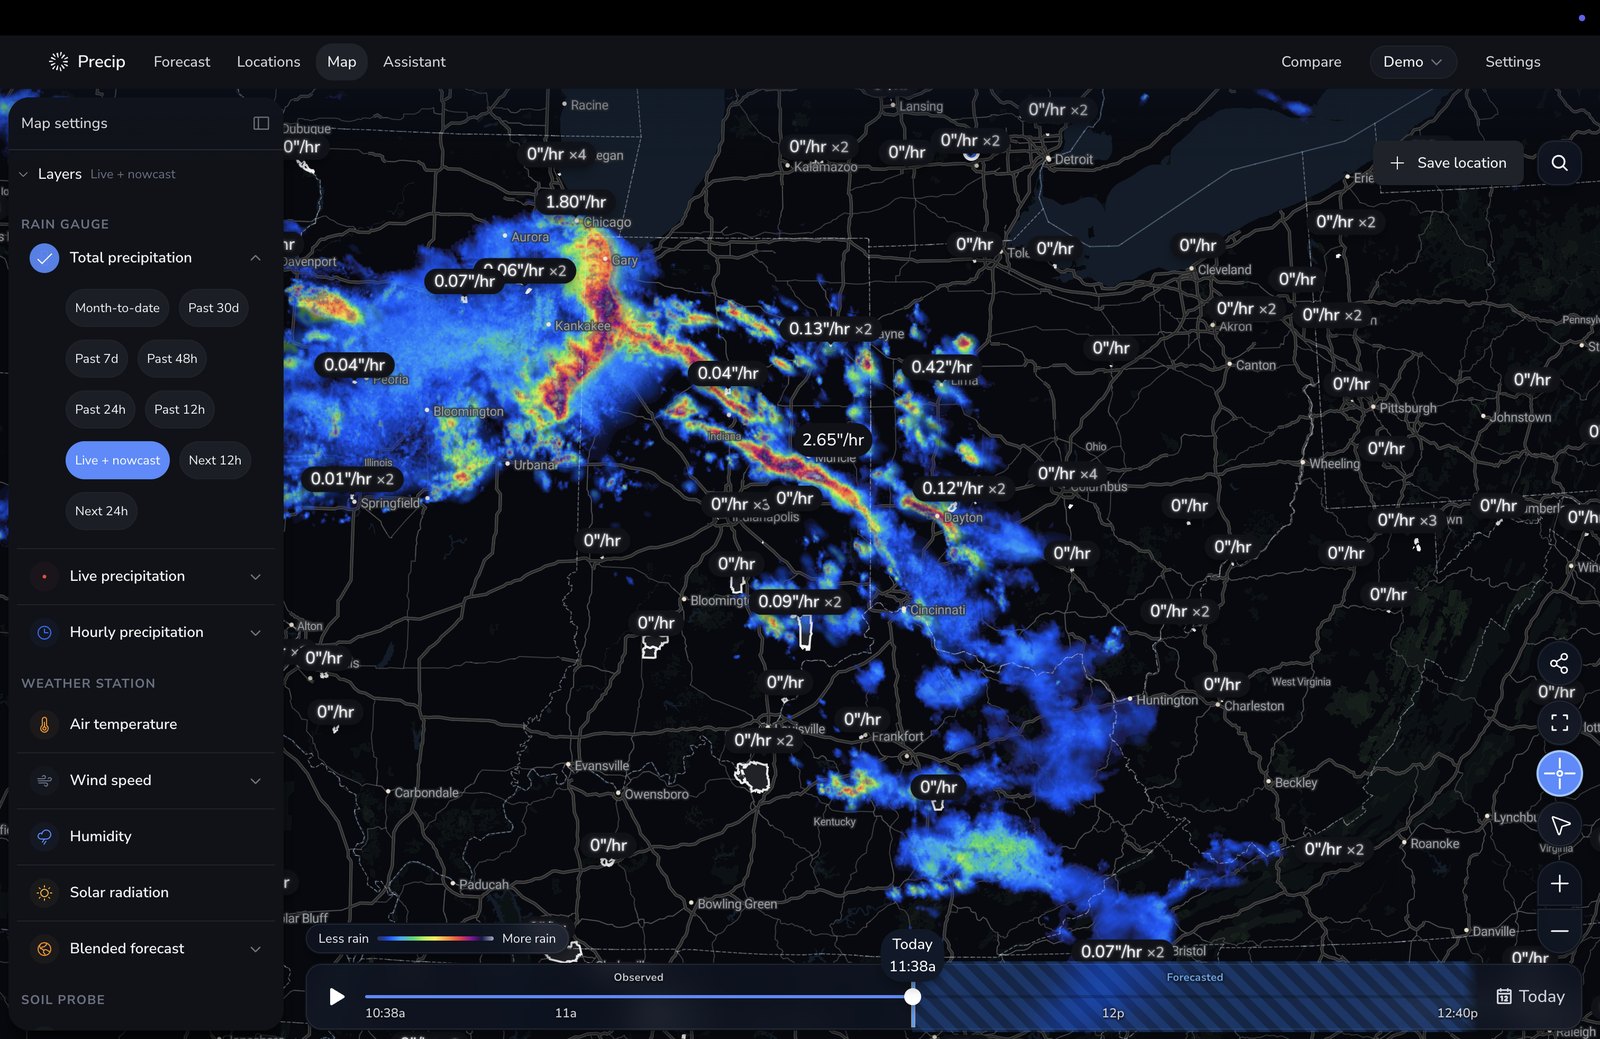
Multi-site operations
What actually happened, next to what happens next.
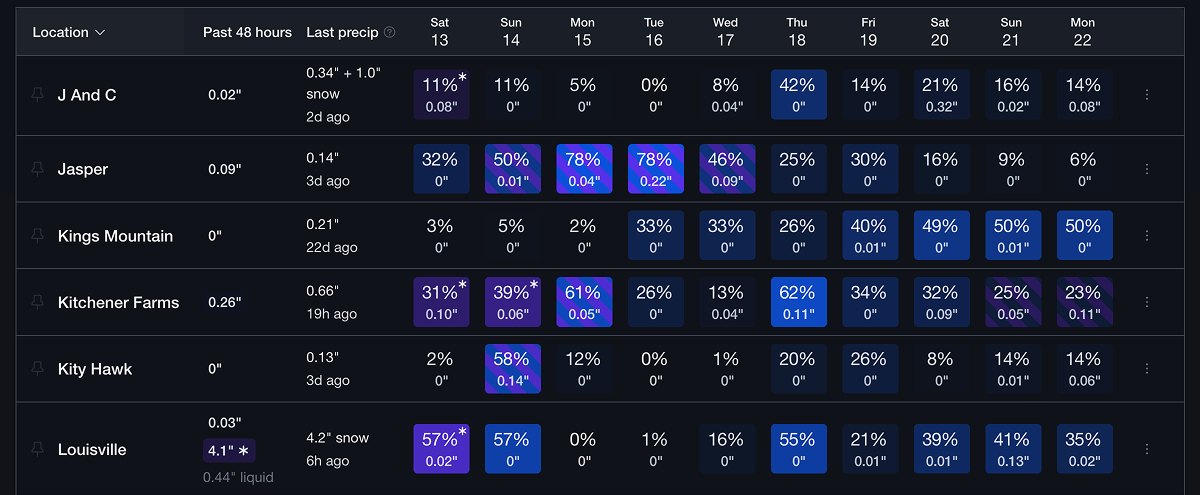
Every site on one screen: measured totals for the last 48 hours, when it last rained, and the 10 day forecast in the same row. Build the schedule from the record instead of calling customers to ask how much they got.
- Save a site by search, or drop the map crosshair on a field or trailhead that has no address
- Group sites by region, crew, customer, or crop, then filter to one group
- Sort by rainfall, last rain, soil moisture, temperature, wind, ponding, or an active weather alert
- Pin the handful of sites that matter today to the top
What a professional plan adds
The parts built for running an operation.
Everything in the consumer app, plus the alerting, exporting, and shared access that a team needs to act on weather together.
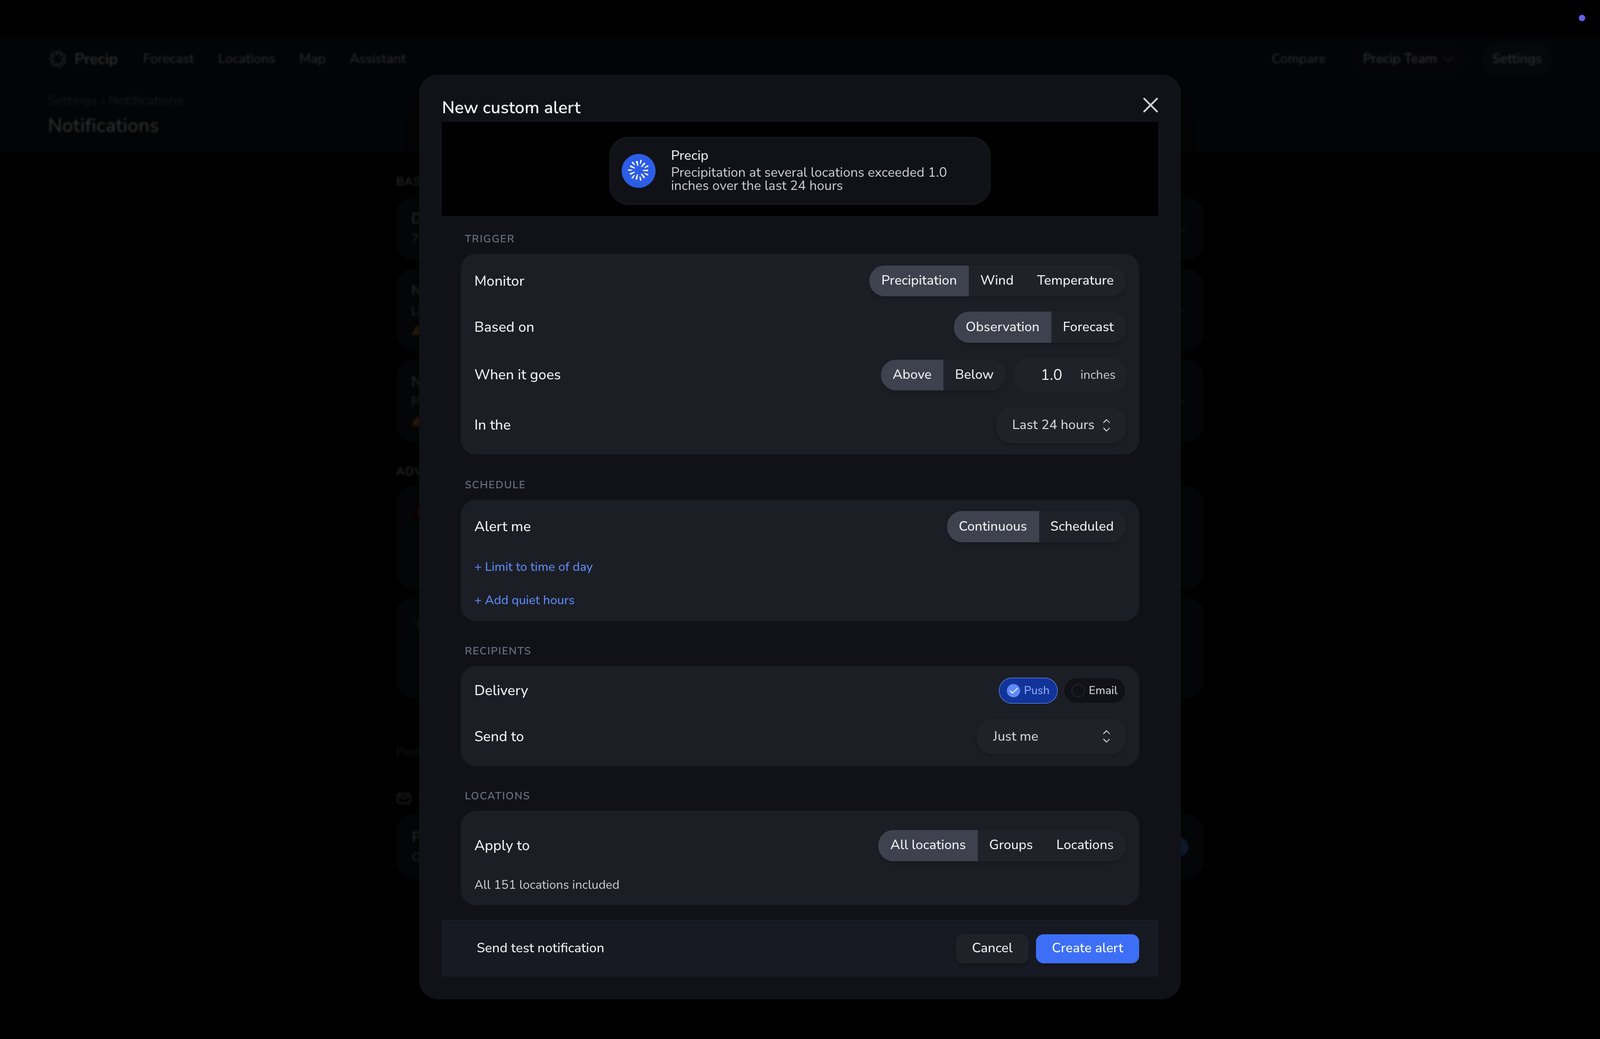
Custom alert thresholds
Get told when a site crosses your line.
Write the rule once and let it watch every site for you. Precip checks measured conditions against your threshold and sends the alert, so nobody has to read a radar loop to decide who works tomorrow.
- Precipitation, wind, or temperature, on measured conditions or on the forecast
- Fires above or below the amount you set, over a 12 hour, 24 hour, or 7 day window
- Continuous checks through the day, or a single scheduled alert at your hour
- Scope a rule to one site, a group of sites, or the whole organization
- Route it to yourself, specific teammates, or everyone, by push or email
- Quiet hours so an overnight storm does not wake the crew
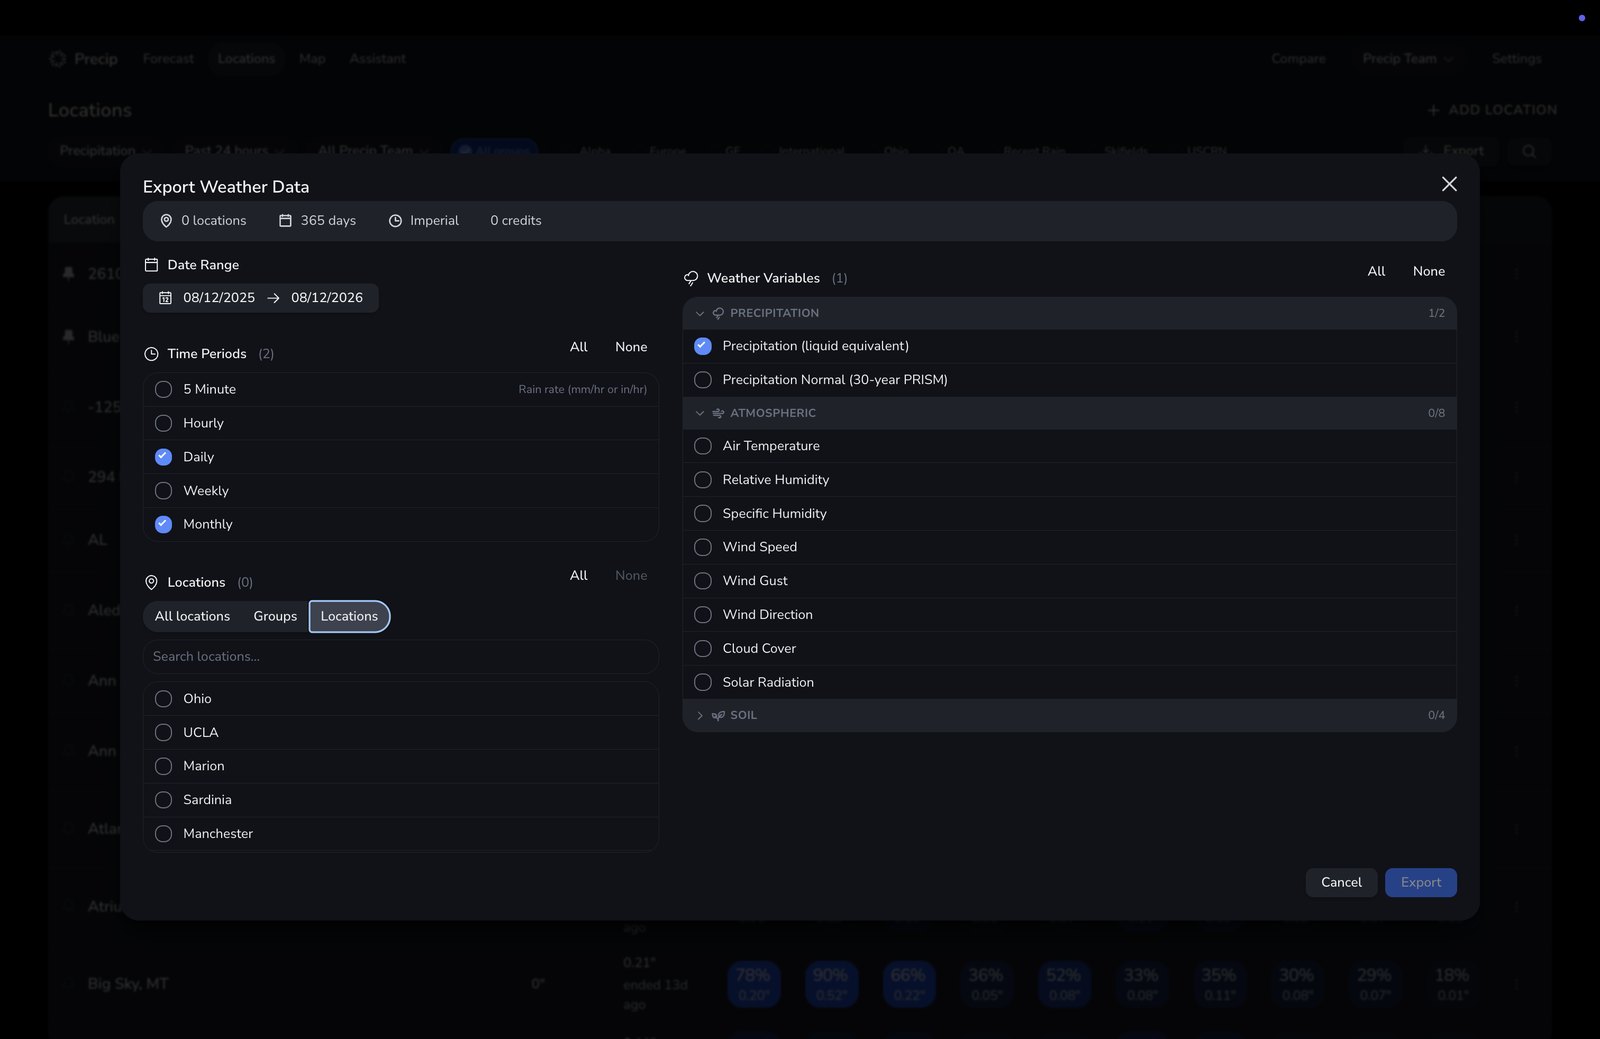
Data export
Take the record with you.
Pull an Excel spreadsheet of measured conditions for as many sites as you need, then hand it to a claims adjuster, an agronomist, or your own analysts.
- Precipitation, temperature, humidity, wind speed, gusts and direction, cloud cover, solar radiation, soil moisture, and soil temperature
- Roll it up 5 minute, hourly, daily, weekly, or monthly
- Up to five years of history in a single request
- Every site, one group, or a hand-picked selection
- Download it immediately, or let a large export finish and land in your inbox
- Long-term normals beside the measurements, so a season has context
Multi-user organizations
One shared map for the whole operation.
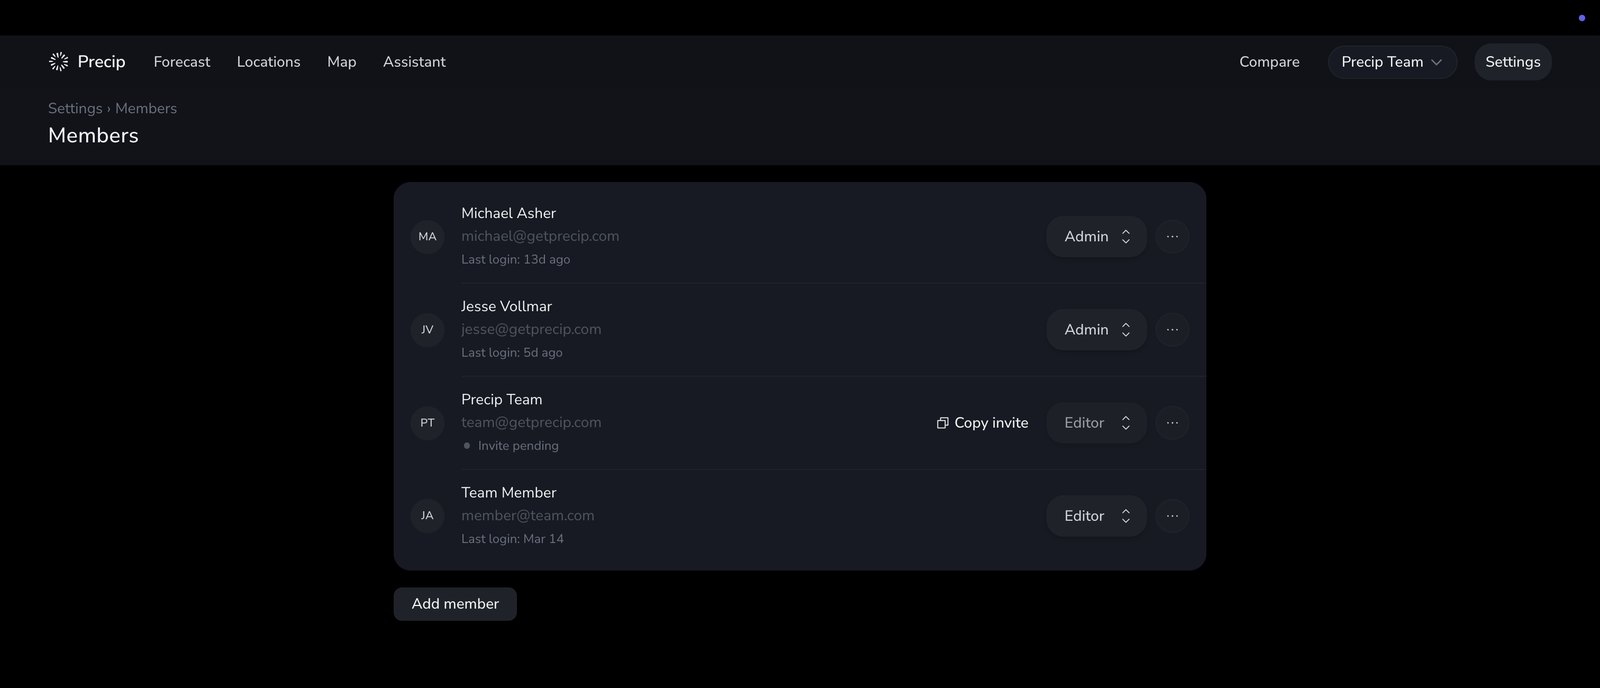
Sites, groups, and alert rules live with the organization instead of one person's phone. When somebody leaves, the record stays.
- Invite teammates by email into a shared workspace
- Admin, editor, and viewer roles, so the field can look without changing anything
- Restrict a member to the groups of sites they are responsible for
- Shared groups for regions, crews, customers, or crops
- Your logo in the app, and a year that starts on your fiscal or water year
Boundaries
Bring the shapes you already have.
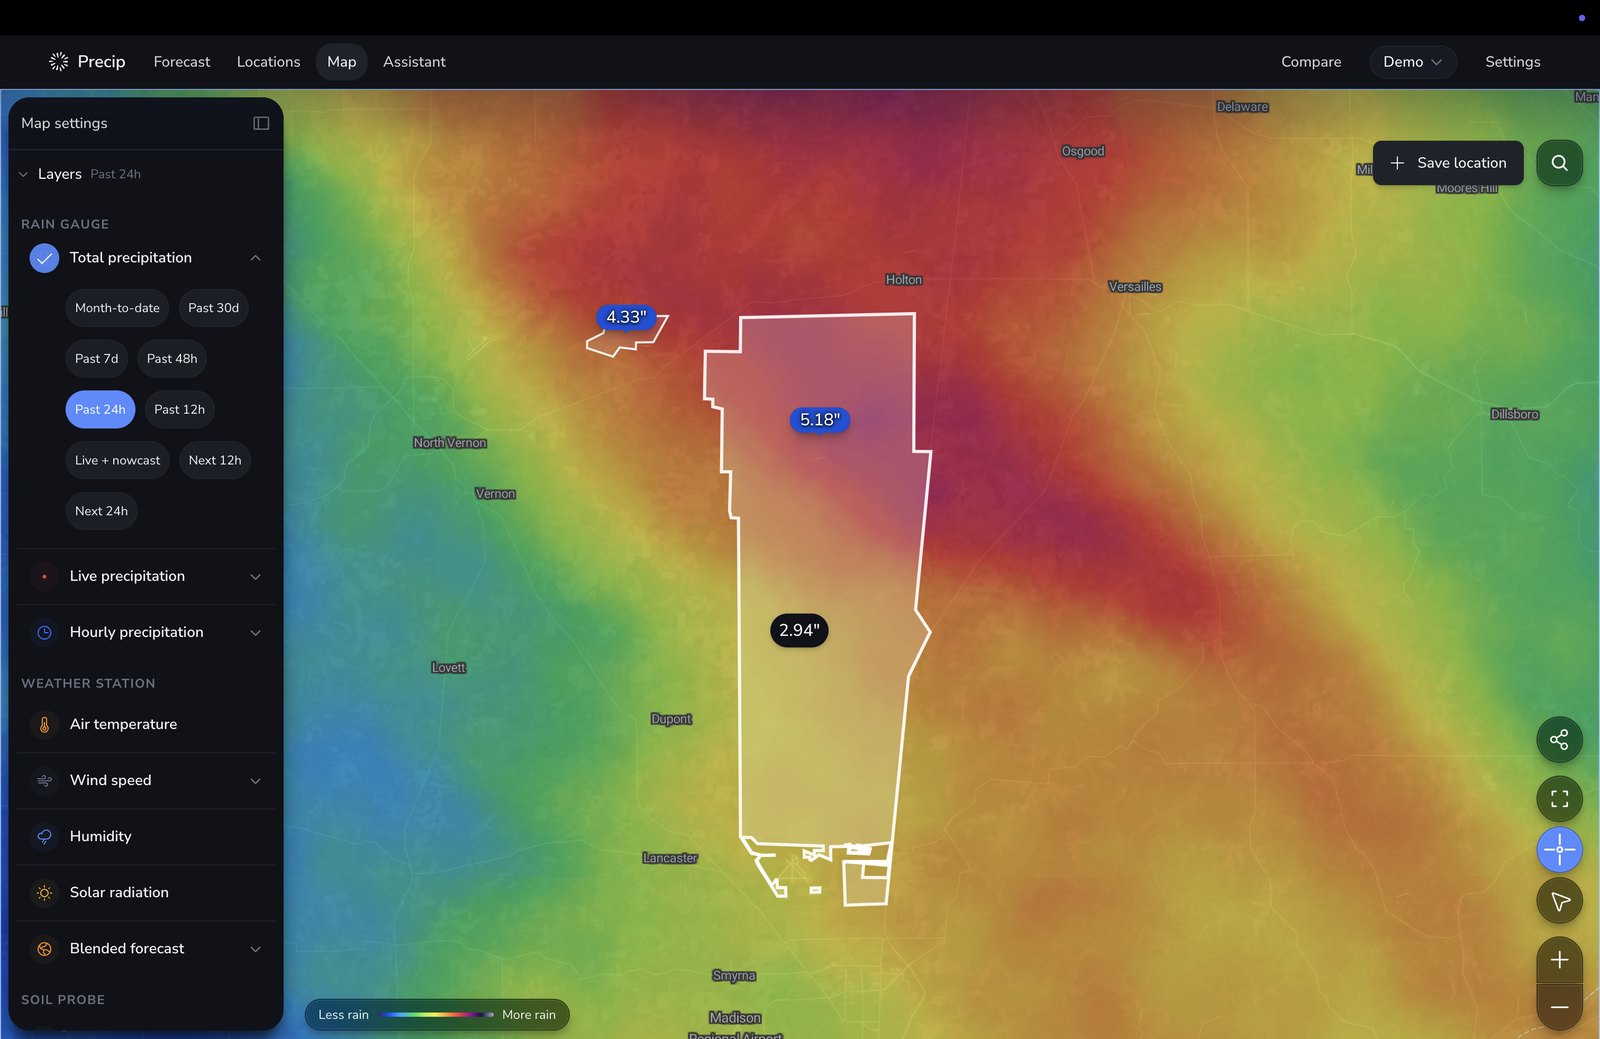
A pin answers for a point. A boundary answers for the whole field, parcel, or right of way, including how unevenly the rain fell across it.
- Import a zipped shapefile, a KML, or connect an ESRI Feature Service URL
- Imported boundaries appear on the live map alongside your pins
- Area totals across the whole shape, not just its center point
- Average, lightest, and heaviest rainfall within the boundary, plus the spread
- Over the last 24 hours, 48 hours, 7 days, month to date, and 30 days
- Bulk import points too, from CSV, Excel, or KML
Measured, not modeled
A record you can defend.
Precip fuses Doppler radar with a quality-controlled gauge network, so the total at a site is an observation rather than a forecast relabeled as history. Estimates keep improving as more gauge reports arrive for a storm.
A virtual rain gauge at every site, including the ones you would never put a physical gauge on.
Snowfall totals and snow depth, which a tipping-bucket gauge cannot measure at all.
The number for yesterday gets more accurate as additional gauge reports land.
Compare NOAA, ECMWF, DWD, and CMC against the Precip AI blend before you commit a crew.
For developers
1 km precision precipitation, in one API call.
Put Precip's measured history and hyperlocal conditions inside your own product. Pass a coordinate, get the record back. There is also an embeddable UI if you would rather drop our map and charts straight into your app.
- Precipitation
- Snowfall & snow depth
- Temperature
- Relative & specific humidity
- Wind speed, gusts, direction
- Cloud cover
- Solar radiation
- Soil moisture
- Soil temperature
const longitude = -83.7430;
const latitude = 42.2808;
const url = `https://api.precip.ai/v1/hourly?lon=${longitude}&lat=${latitude}`;

fetch(url, {
  headers: {
    'Accept': 'application/json',
    'Authorization': `Bearer ${YOUR_API_KEY}`,
  },
})
  .then(response => response.json())
  .then(data => {
    // Hourly rainfall history here
    console.log(data);
  })
Stop guessing what fell
See how Precip fits your operation.
A short walkthrough with our team, using your own sites, so you can see the measured record before you commit to anything.
Schedule a demo